

Measurement

Peter Quadrel
8 min read
No Meta metric means anything alone. People 55 and over clicked 59% more often but bought 24% less per visit. How to read Meta ads metrics in pairs.
Most teams read Meta one number at a time. CPM rises, so it was a bad week. CTR jumps, so the new ad is a winner. ROAS slips, so the team swaps the creative.
Each of those numbers is one factor in the same equation. One can move while results hold, and one can hold while results fall. Read alone, they send a team to fix the wrong thing while the real leak keeps running.
So which Meta metrics belong together, and in what order should you read them to find what broke?
Read every metric next to its pair, and start with the two ratios we call the most important equation on Meta. Click quality is the share of outbound clicks that become landing page views. Conversion rate is the share of those views that become purchases. Together they show whether a drop came from clicks that never arrived or from visitors who never bought.
In our data, ads whose clicks often failed to load the page had 15% lower ROAS than the rest of their account. People 55 and over clicked 59% more often than younger people, and their ROAS was also 15% lower.
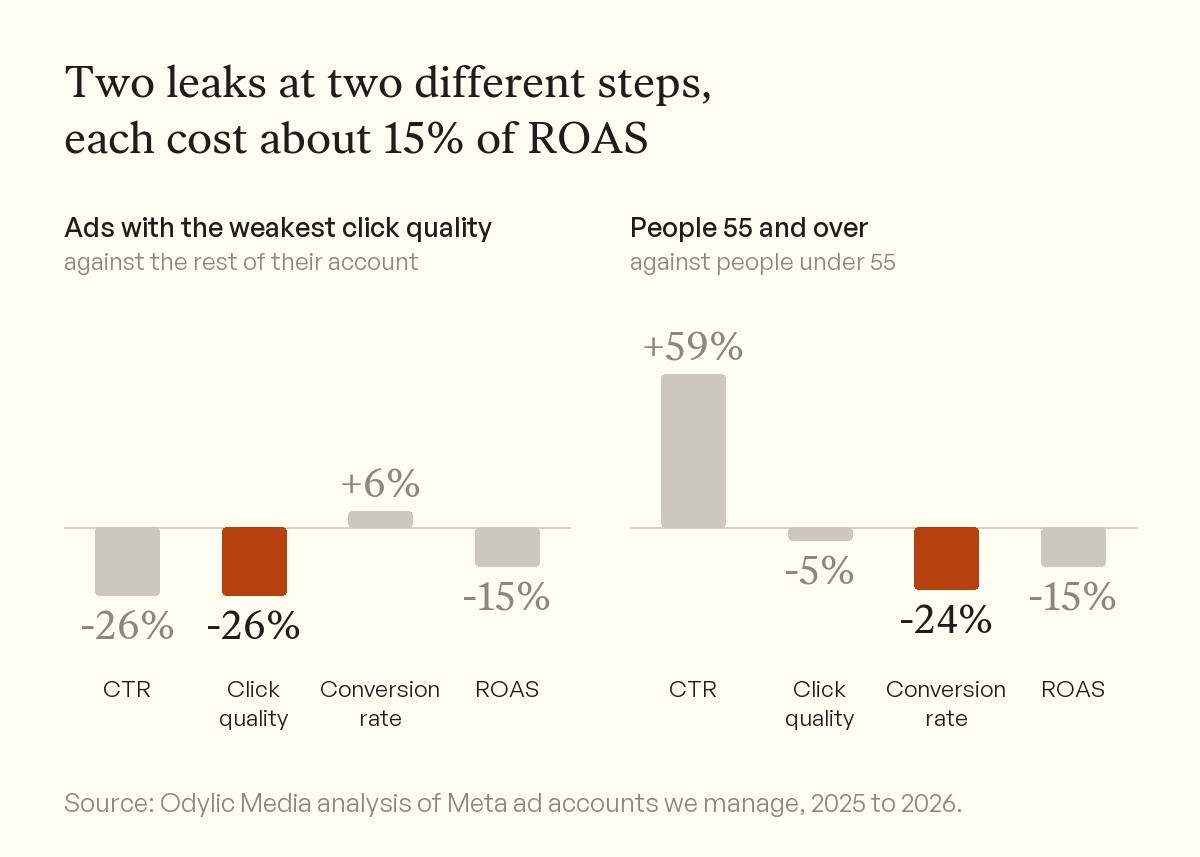
Weak clicks lose buyers before the page loads. Older visitors lose them after it. Both cost about 15% of ROAS.
Here is what we found. ROAS is five ratios multiplied, so every metric needs its pair. Click quality breaks first, before your site gets a say. Conversion after the page shows whether Meta found buyers, and three patterns show where to look.
I. ROAS is five ratios multiplied, so no metric works alone
ROAS is revenue divided by spend. Write out each step from impression to sale, and it becomes one line.
ROAS = 1,000 × CTR × click quality × conversion rate × AOV ÷ CPM
Here CTR is clicks per impression, click quality is landing page views per click, and conversion rate is purchases per landing page view. Use the same kind of click, outbound or link, in CTR and in click quality. Enter each rate as a decimal, so 1.2% is 0.012.
The equation explains why single metrics mislead. Any number on the right can move without ROAS moving, as long as another number moves the other way.
It also sorts the metrics into pairs. CPM and CTR together give you cost per click. Cost per click and the two conversion steps give you cost per purchase. Cost per purchase and AOV give you ROAS.
Our day of week study shows the first pair at work. Across the brands we manage, CTR ran about 4% higher on weekends than on weekdays, and it did so in every brand. CPM ran about 5% higher on weekends too. The two cancelled out, and ROAS showed no weekend difference we could trust.
Placements show the same thing on a bigger scale. Instagram Reels cost half as much as Instagram Feed per 1,000 Meta Accounts reached. Instagram Feed turned 1.8 times as many of the people it reached into buyers. Across placements, the gaps in ROAS were too small to trust.
The third pair is conversion rate and AOV. Our paper on higher AOV follows a premium brand whose conversion rate fell 54% while revenue per session rose 10%.
CPM on its own is the weakest read of all. In our study of funnel stages, CPM alone told a cold ad from a warm one no better than a coin flip. Our paper on high CPMs shows how to split it before you act.
So when ROAS drops, which pair do you check first?
II. Click quality breaks first, before your site gets a say
Start with three of Meta's own numbers. Outbound clicks are clicks on links that take people off Meta to your site (Meta). Landing page views count the times one of those clicks loaded your page. Purchases are the sales Meta credits to the ad.
Click quality, which some teams call landing page view rate, is landing page views divided by outbound clicks. Use the plain click count, not unique outbound clicks. Landing page views count every page load. Mixing a unique count with a total can push the ratio past 100%.
Link clicks also work as the base, and our studies use them. Outbound clicks are the stricter choice, because link clicks include some clicks that stay inside Meta. Pick one and keep it.
To see what weak click quality costs, we ranked the ads in each account we manage by click quality. Then we compared the bottom quarter with the rest of the same account.
The weakest ads had 26% lower click quality. Their CTR was 26% lower too. Once people landed, they bought at least as often as visitors from the account's other ads, with a conversion rate 6% higher. Even so, their ROAS came in 15% lower, and it was lower in most brands.
The leak sat between the click and the page. The site did its job for the people who reached it.
There is no single good number to aim for. Across the brands we manage, account-level click quality ran from 62% to 96% in mid 2026. The site, its speed and the tracking setup all move it, so judge each account against its own history.
The market has shifted too. Click quality across the brands we manage fell from 89% to 81% in a year, as our paper on net new reach shows.
Meta will not police this for you. In our signal study, an ad's early click quality had no link to the budget Meta gave it later. Meta's budget follows purchases.
Click quality also gives you the earliest read, because it is final the same day. Ads Manager credits a sale to the day someone clicked or saw the ad, not the day of the sale. Under a 7-day click window, last week's purchases are still filling in. In our experience, click quality moves before ROAS does.
Click quality tells you whether people arrived. It cannot tell you whether they were buyers.
III. Conversion after the page shows whether Meta found buyers
Conversion rate here is purchases divided by landing page views. It answers a different question. Were the people who arrived the people who buy?
Count only click-through purchases for this ratio, using 7-day click. View-through and engage-through purchases never came through a click, so they inflate it. Since March 2026, a like, save or share no longer counts as a click, as our paper on Meta attribution settings explains.
This ratio catches what CTR hides. Over the year to August 2026, people 55 and over clicked our brands' ads 59% more often than people under 55. That held in every account we checked.
Their clicks landed almost as often, with click quality 5% lower. But each landing page view turned into a purchase 24% less often. ROAS came in 15% lower, and it was lower in most accounts. Their CPM also ran 39% higher.
A team that reads CTR alone would call that audience a winner. Read next to conversion, it is a group that clicks easily and buys less often per visit.
That matters because delivery drifts between age groups over time. In most brands we manage, people 55 and over now take a bigger share of spend. The median share rose 6.7 points from the year to August 2024 to the year to August 2026.
Their share of purchase value rose as well, so this is not simply wasted money. It does mean an account's CTR can climb while its conversion rate slips, with no change to the ads.
With two ratios in hand, a ROAS drop can take three shapes.
IV. Three patterns show where the drop started
The first pattern is click quality falling while conversion holds. People click and never arrive. The usual causes are a cheap placement, accidental taps, bots, a slow page or a tracking problem on a new landing page. Check placements first.
Placements differ even inside the same ad. In our study of Reels and Feed, Reels clicks loaded the page 76.7% of the time, against 82.2% for Feed clicks from the same ad. Instagram Reels clicks landed 80% of the time, and Facebook Reels clicks 75%.
If one placement is the leak, block it in your account-level placement controls. Meta has been removing placement exclusions at the ad set level, as our paper on Q4 account structure explains.
Also check whether every campaign dropped on the same day. In January 2026, a Meta reporting bug cut landing page views for about a week, according to Aimerce. A drop that hits everything at once may be a counting problem, not a traffic problem.
The second pattern is conversion falling while click quality holds. The clicks are real, and the people land. Often Meta has moved delivery toward an age, gender or region that visits and does not buy. A price change, a new offer or a weaker page can do the same, so check what changed on the site.
The third pattern is both ratios falling together. That is a broad drop in traffic quality. In our experience, it usually follows a Meta update or an audience expansion that pulled in the wrong people.
If neither ratio moved and ROAS still fell, look at the two ends of the equation. Either clicks got more expensive, which shows in CPM and CTR, or orders got smaller, which shows in AOV.
When either ratio moves, break it down in a set order. Start with placement, because in our experience junk traffic usually traces to one placement. Then check age and gender, because that mix drifts without anyone choosing it. Then check geography.
Meta limits two of these steps. It will not break down age or gender by placement at the same time, so run them one after the other. Region and DMA breakdowns return no website events, so Meta shows no landing page views or purchases by region (Meta for Developers).
Use the country breakdown in Meta. For regions inside a country, use your store or analytics data.
V. Read the pair before you touch the creative
These are the habits we use.
1. Build two custom metrics in Ads Manager this week. Click quality is landing page views divided by outbound clicks. Conversion rate is purchases divided by landing page views, read on 7-day click purchases. Put both next to ROAS in your default columns.
2. Set a baseline from your own last 60 days. Flag any ad or placement whose click quality sits a quarter or more below the account. In our data, the weakest quarter of ads ran 26% below the rest and returned 15% less ROAS.
3. When click quality drops, pull the placement breakdown first. Block the placement that leaks in your account-level controls, and test the speed and tracking of any landing page that changed.
4. When conversion drops, check age and gender, then country, then your store data for regions. Leave the last seven days out of the read, because purchases are still filling in.
5. When both drop, list what changed that week: a Meta update, an audience expansion or a site release. Check whether every campaign fell on the same day before you change anything.
6. Never judge an ad or an audience on CTR alone. Weekends and older audiences both raise CTR without raising sales. Judge creative tests on cost per purchase.
7. Swap creative last. When the cause is a placement, an audience or the page, new creative will not fix it.
When ROAS slips, most teams reach for new creative first. On Monday, put click quality and conversion rate next to ROAS and see which one moved. We have not yet measured how many days ahead of ROAS click quality moves. We also do not know how much ROAS comes back once a leaking placement is blocked.
About this research
The data comes from Meta ad accounts we manage for DTC brands, 2025 to 2026. It uses Meta's own clicks, landing page views and purchases, under each account's attribution setting. Click quality is landing page views divided by link clicks, and every comparison is made inside the same account. These are patterns we observed, not the results of a controlled test, so weak ads and older audiences may differ in other ways too.
See what this means for your account.
A complimentary growth session, built around your account and your numbers.

Meta Algorithm
Meta Picks Your Winner in 72 Hours, on One Purchase
At 72 hours, the ad Meta goes on to fund has a median of one purchase, and 37% have zero. More data does not make Meta's pick more profitable.

Meta Algorithm
Meta Does Not Push More Spend to Your Higher-Engagement Ads
Across the brands we manage, engagement explains 0.07% of where Meta puts spend, and a jump in likes buys no extra budget the next day. Meta funds sales.

Creative
A Few Ads Carry Every Meta Account. Your Best Ad Fades in 90 Days
The top 10% of Meta ads take 64% of a typical month's spend, and that is normal. The risk is turnover: your #1 ad fades within three months.