

Meta Algorithm

Peter Quadrel
7 min read
A premium brand raised AOV 138% and its conversion rate fell 54%, yet revenue per session rose 10%. Why higher AOV scales to 8 figures on Meta.
Most founders watch conversion rate more closely than any other number on their site. When it falls after a price increase or a push into bigger orders, they read it as a broken funnel.
So they run a discount, rebuild the landing page or push a cheaper hero product. All three moves rest on one belief, that the conversion drop cancels out the higher AOV.
That belief can cost a premium brand its best growth lever. Conversion rate does fall when AOV rises, but it rarely falls far enough to cancel out the bigger orders. A bigger order is also what lets you outbid other brands on Meta.
So we asked two questions. Does the conversion drop cancel out a higher AOV? And how long does a premium price keep working?
The answer is simple. Higher AOV gets you to eight figures, and cheaper SKUs get you past it.
We found four things. Conversion rate falls, but each visit makes more money, and a bigger order lets you pay more for every buyer on Meta. Then the pool of buyers who can afford you runs out, and past eight figures a more accessible product reopens growth.
I. Conversion rate fell by half, but each visit made more
We tracked a premium brand we manage for four years, quarter by quarter, as it grew from seven to eight figures. Over that stretch, its average order value climbed every year.
Its AOV rose 138%, from $625 to $1,489.
Its conversion rate fell 54%, from 0.78% to 0.36%.
That looks like a funnel in trouble. Revenue per session tells a different story. It rose 10%, from $4.88 to $5.36.
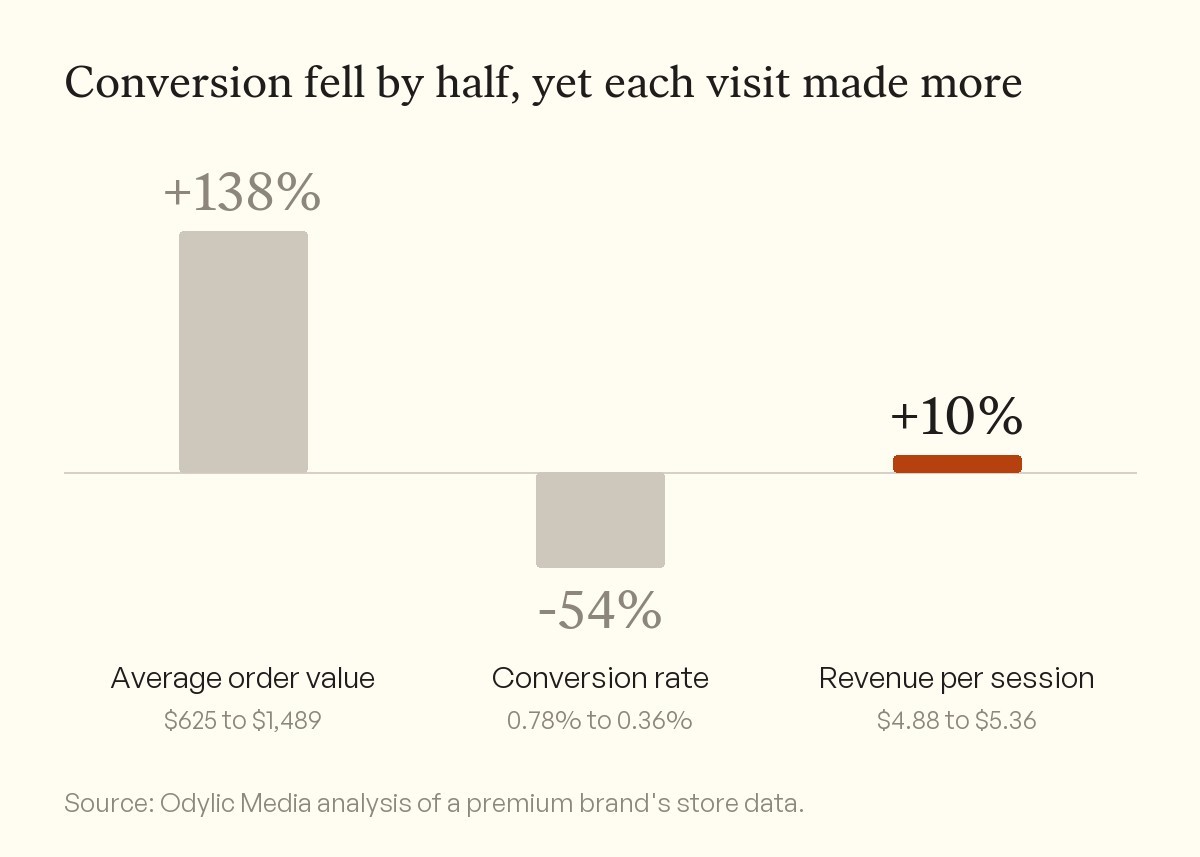
Conversion rate fell by half, but the bigger orders more than made up for it, so each visit was worth more.
Revenue per session is AOV times conversion rate. It tells you what each visit to your site is worth. It is the right number for judging a price change, because it holds both sides of the trade.
Over the same years, the brand's annual revenue grew 3.3 times.
The two numbers did move against each other. Every $100 added to AOV pulled conversion rate down about 0.04 percentage points. That is a real cost, but a small one next to the size of the bigger orders.
The link was loose. Holiday months broke the pattern, because November and December brought some of the highest order values and the highest conversion rates of each year. Outside those months, the pattern was much tighter.
We checked the result on a second cut of the same store's data, month by month. Revenue per session rose about 14% from 2023 to 2025.
There is one caveat. In the first half of 2026, revenue per session dipped about 3% from a year earlier. In those months, more of the brand's sales happened offline. Online conversion rate misses a buyer who browses the site and then buys somewhere else.
So the conversion drop did not cancel out the bigger orders. Why does a bigger order help this much on Meta?
II. A bigger order lets you pay more for every buyer
Your CPA ceiling is the most you can pay for one purchase and still hit your target. It moves with AOV. At the same ROAS target, an order 138% bigger lets you pay 138% more per purchase.
Take a 2.0 ROAS target. At the start, this brand could pay about $310 for a purchase. At the end, it could pay about $745.
That room matters because Meta sells its ad space by auction. Meta's auction does not simply give the slot to the highest bid. It also weighs how likely each person is to act on the ad, and the quality of the ad (Meta, About the ad auction).
The bid still counts. In our experience, people with money to spend cost the most to reach, because every premium brand wants them. A brand that can afford a higher cost per purchase wins more of those auctions and keeps winning them as it scales.
Value optimization pushes the same way. Meta's developer guide says its system values each conversion in proportion to the value you send back (Meta, Value optimization). That is the logic behind the "maximize value of conversions" performance goal, which bids for higher-value purchases. Meta reported that advertisers on that goal saw 12% higher ROAS on average than advertisers who optimized for the number of conversions (Meta, June 2025).
Bigger orders also cost less to ship per dollar of revenue. From 2022 to 2025, the brand's annual revenue grew 3.3 times, but its order count grew only about 1.9 times.
So for the same revenue, the brand had more than 40% fewer orders to pick, pack and ship. That saving goes back into what the brand can pay Meta for the next buyer.
If bigger orders make every visit and every buyer worth more, why not keep raising prices?
III. The pool of buyers who can afford you runs out
Every price tier you add shrinks your TAM, the total market of people who could buy from you. Fewer people can afford a $1,500 order than a $600 one.
At seven figures, that rarely matters. The pool of people who can afford you is still big enough to scale into.
The pool has a limit, and growth slows once you have worked through it. The same brand shows what that looks like. Its growth slowed year by year as AOV climbed, and in the latest year its order count fell while revenue still grew. All of that growth came from bigger orders, not more of them.
We cannot prove that price caused the slowdown. Growth slows for every brand as it gets bigger. But the shape matches what we see in premium accounts near the top of their market. Revenue keeps coming from fewer, larger orders, and each new buyer costs more to find.
In our experience, the limit shows up in the Meta account before it shows up in revenue. Frequency climbs. New customers become a smaller share of buyers. Cost per new customer rises, while returning buyers keep blended ROAS looking healthy.
Our paper on how Meta overfits your account describes the same trap from the account side. The pixel keeps finding more of the buyer it knows until there are none left at your price.
The platform adds pressure too. In our study of Meta's ad supply, the average person saw about 50% more ads in 2025 than in 2020. So every brand is competing for attention in a more crowded feed.
So what do you do when the pool of buyers at your price runs dry?
IV. Past eight figures, an accessible product reopens the market
Past eight figures, add a more accessible product. It can be an entry piece, a smaller size or a lighter line. The goal is to reach people who want the brand but will not spend $1,500 on a first order.
That reopens TAM without touching the premium line. Luxury houses do the same with fragrance and small leather goods next to their bags.
The order matters. Go premium first and expand down later, because in our experience raising prices on a customer base trained to buy cheap rarely works.
A brand that starts premium can add an entry product and keep its position. A brand that starts cheap has to retrain every buyer it has.
The new product also needs its own setup on Meta. Value optimization favors the biggest orders, so a cheaper product in the same campaign as your hero can get starved of spend. Give it its own campaign or ad set, with its own CPA target, and judge it on its own numbers.
Meta is starting to help with this. In June 2025, Meta said it was testing a way to send the profit from each sale through the Conversions API (Meta, June 2025). That lets Meta optimize for profit, not just order size. We now see a Profit option next to Value in some accounts.
If your cheaper product carries a better margin, check whether your account has it. It only works if the cost of every product is filled in, because Meta bids on the profit numbers you send.
So the decision comes down to reading the right number and spotting the ceiling early. Here is how we do both.
V. Check revenue per session before you cut price
1. Check revenue per session before you touch the funnel. Multiply AOV by conversion rate for each of the last four quarters. If it held or rose after a price increase, leave the funnel alone.
2. Compare each quarter with the same quarter a year earlier. Holiday months lift both AOV and conversion rate, so a holiday quarter next to a quiet one will mislead you.
3. From seven to eight figures, lead with your premium SKUs and bundles. Put them in your ads and at the top of your landing pages.
4. Set a free shipping threshold just above your current AOV. It gives the typical buyer a reason to add one more item. Move it up as AOV rises.
5. Reset your CPA ceiling every quarter by dividing AOV by your target ROAS. If you run a cost per result goal, raise it as AOV rises. A ROAS goal adjusts on its own, because it is set on value.
6. Track order count, new customer share and cost per new customer every quarter. When revenue grows only because orders got bigger, start building the accessible product.
7. Past eight figures, launch the accessible product in its own campaign or ad set, with its own CPA target. Keep it out of value-optimized campaigns built around your hero.
8. If you are still early, set your price where you want to end up. Adding a cheaper product later is far easier than raising prices on buyers who are used to paying less.
The founders in our opening saw conversion rate fall and assumed the funnel broke. For a premium brand on the way to eight figures, a falling conversion rate is often the price of a better customer.
On Monday, pull revenue per session for your last four quarters before you change a price or a page. We still do not know where the ceiling sits in each category, or how much an entry product takes from the premium line.
About this research
The core numbers come from the store data of a premium brand we manage, by quarter from 2022 to 2026. We checked them against a monthly cut of the same data. Revenue per session is average order value times conversion rate, and conversion rate counts online visits only. This is a single brand's history, so it shows what happened as order values rose, not what a price change will cause.
See what this means for your account.
A complimentary growth session, built around your account and your numbers.

Meta Algorithm
Meta Picks Your Winner in 72 Hours, on One Purchase
At 72 hours, the ad Meta goes on to fund has a median of one purchase, and 37% have zero. More data does not make Meta's pick more profitable.

Meta Algorithm
Meta Does Not Push More Spend to Your Higher-Engagement Ads
Across the brands we manage, engagement explains 0.07% of where Meta puts spend, and a jump in likes buys no extra budget the next day. Meta funds sales.

Creative
A Few Ads Carry Every Meta Account. Your Best Ad Fades in 90 Days
The top 10% of Meta ads take 64% of a typical month's spend, and that is normal. The risk is turnover: your #1 ad fades within three months.