

Measurement

Peter Quadrel
8 min read
Meta Ads Manager hides net new reach. Here is how to calculate it, and why to pair it with click quality: landing page views fell from 89% to 81%.
Most brands check for saturation on Meta the same way. They look at reach and frequency in Ads Manager. If reach holds up and frequency stays under 3, they assume the account still has room to grow.
That check misses the number that matters most. Reach in Ads Manager counts the people your ads reached inside the dates you picked. It cannot tell you whether they are the same people you reached last month.
So an account can look healthy for weeks while it shows ads to the same crowd again and again. By the time CPA spikes and new customer ROAS falls, the problem started a month earlier.
The past year also changed what new reach is worth. Across the brands we manage, Meta looks to be spreading budget across more people than a year ago. The clearer change is that fewer of their clicks make it to the website.
So how do you tell whether your Meta spend still finds new people, and whether those people are worth paying for?
The missing metric is net new reach. Ads Manager does not show it, but you can calculate it in a few minutes. Read it next to landing page view rate. The share of Meta clicks that loaded the landing page fell from 89% to 81% in a year.
Here is what we found. Ads Manager only counts reach inside one date range. Fewer Meta clicks reach the site than a year ago, though the drop has leveled off. Two date ranges give you net new reach, and it works best as an early warning read next to click quality.
I. Ads Manager counts reach inside one date range only
Reach in Ads Manager is the number of Meta Accounts that saw your ads at least once (Meta, About reach metrics). Meta stopped counting "people" in 2023, so a person with linked Facebook and Instagram accounts counts once (Jon Loomer). Meta also labels reach as an estimate.
Meta removes duplicates inside the date range you choose. Pick July and you get the unique people reached in July. Pick July and August together, and anyone reached in both months counts once.
That is the blind spot. A month of reach looks the same whether it found new people or the same people as last month.
Frequency has the same problem. It is an average over the window, so a few heavy viewers and many light ones can add up to a calm number.
The closest tool Meta offers is the audience segments breakdown. In sales campaigns, you define your engaged audience and existing customers in Advertising settings. Ads Manager then splits results into new audience, engaged audience and existing customers.
It helps, but it answers a different question. "New audience" means anyone outside the lists you defined. A person who has seen your ads every week and never clicked still counts as new. Meta also only tracks segments from the day you set them up.
One more change is worth knowing. In June 2026, Meta retired the old reach metric in organic Page and post insights. Media views and viewers replaced it (Meta for Developers). Ads Manager still reports reach and frequency for ads, and that is all the method below needs.
As of October 2026, no default column in Ads Manager tells you whether this month's spend found new people. That gap hid a big shift over the past year.
II. Fewer Meta clicks reach the site than a year ago
Across the Meta accounts we manage, we compared six weeks from mid May to late June 2026 with the same weeks of 2025. We matched days of the week and compared each brand with itself.
Three numbers leaned toward more new reach. Median account frequency fell from 3.48 to 3.13. People reached per $1,000 of spend rose from about 11,600 to 13,700.
Meta's own audience segment split pointed the same way. The new audience share of spend rose from 83% to 86%.
Each of those moved in the expected direction in about two thirds of brands. None was strong enough to trust on its own.
One number was clear. Landing page view rate is the share of link clicks that went on to load your landing page. It fell from 89% to 81%, a drop of 8 points.
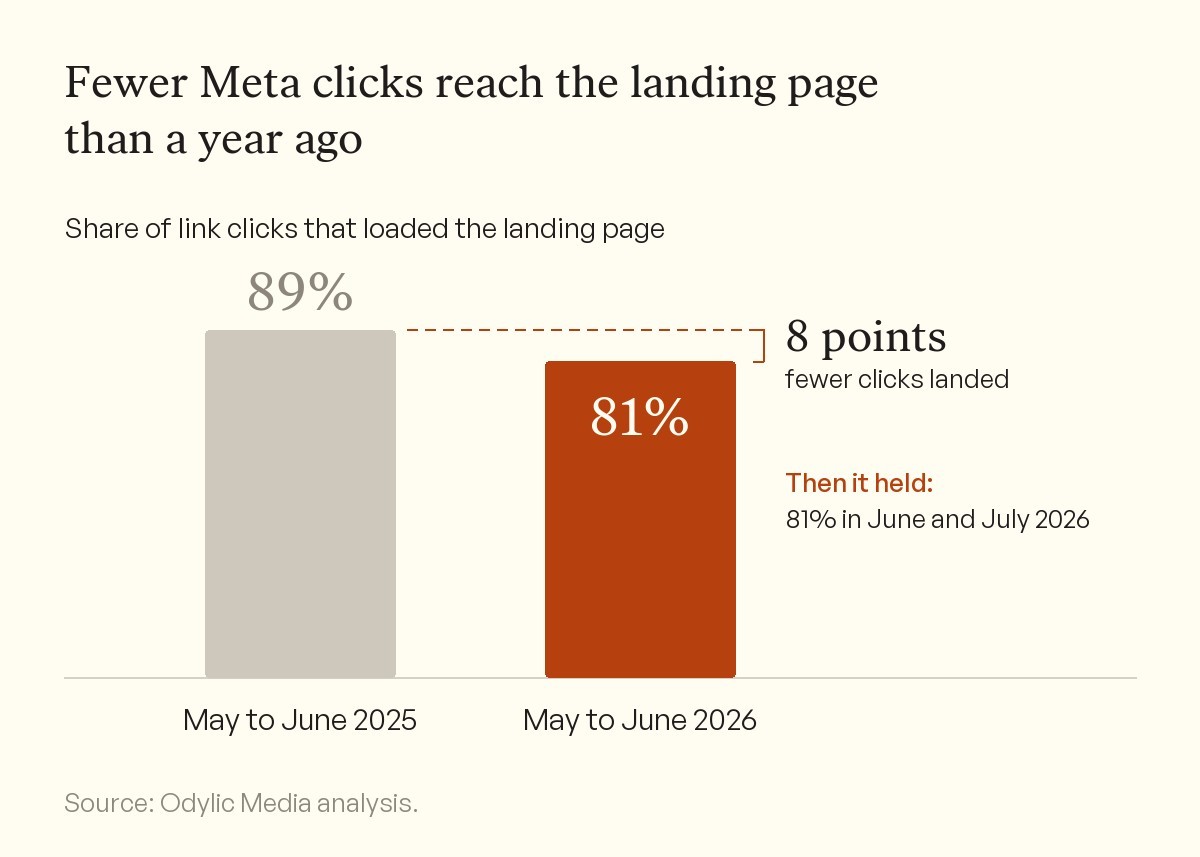
In one year, 8 fewer of every 100 Meta clicks reached the landing page, and the rate has not recovered.
The drop showed up in four out of five brands. It was the one change in the study strong enough to trust.
Purchases per 1,000 people reached also slipped, from 0.84 to 0.73. Like the reach numbers, that leaned the expected way but was too small to trust alone.
Customer data told a mixed story. In one brand, new visitors rose from 74% to 82% of Meta traffic. In another, new customer ROAS fell from 0.93 to 0.72. The same numbers moved the other way or not at all in other brands, so we treat these as examples, not proof.
The shift fits the platform picture. Our paper on Meta's ad saturation gap found that each person now sees about 50% more Meta ads than in 2020. That paper also argues that Meta's newer systems are built to show more ads with less repetition. Wider reach for each account is what that would look like from the inside.
Meta did not do this alone. Advertisers, us included, have asked for more new reach for years. The new reach everyone asked for came with weaker clicks.
The drop has since leveled off. We checked again through the summer of 2026. Landing page view rate was 81.4% in June and 81.3% in July.
Account frequency over 28 days dipped from 2.76 in early May to 2.43 in June, then recovered to 2.62 by late July. The share of landing page views that turned into purchases rose slightly, from 1.2% in early May to 1.4% in July.
So this looks like a one-time step that has settled, not a trend that keeps getting worse. The new baseline still matters, and to see where your own account sits, you need net new reach itself.
III. Two date ranges give you net new reach
Net new reach is the number of people your ads reached this period who did not see them in the period before. You can build it from three reach numbers in Ads Manager.
1. Pull account-level reach for Period A, such as July.
2. Pull account-level reach for Period B, such as August.
3. Set the date range to cover both periods and pull reach again. Meta counts anyone reached in both periods once.
4. Subtract Period A reach from the combined reach. The result is your net new reach.
5. Divide net new reach by Period B reach. The result is your net new reach rate.
The rate is the share of this period's reach that your ads did not reach in the period before. It does not mean people who have never seen your brand. Someone you reached before Period A counts as new again.
Use account-level totals and keep both periods the same length. Adding up campaigns or weeks counts the same person more than once.
These are the ranges we work from. A rate of 60% or more is healthy. A rate that falls week over week while spend holds flat is a warning. A rate under 40% with frequency above 3 is critical.
Set them against your own account's history, not ours. Reach is an estimate, so ignore small moves and look for a trend that lasts several weeks.
If you pull reach through Meta's API, log it as you go. Since June 2025, Meta has stopped returning reach for queries with breakdowns that start more than 13 months back (Meta for Developers).
A number on its own is not a plan. What makes net new reach useful is what it tells you before your CPA does.
IV. Net new reach warns you early, so read it with click quality
When net new reach falls, Meta is running out of new people it can reach at your price. In our experience, it then moves budget toward easier sales from people who already know your brand.
Those sales still show up in Ads Manager, so ROAS looks fine for a few weeks. Underneath, new customer growth is slowing. CPA only moves once that pipeline runs dry, and by then the problem is about a month old.
We see this in the accounts we take over and audit. We have not measured the lead time across brands, so treat net new reach as a warning light.
Our paper on how Meta overfits your account shows where this ends. One brand had reached 16.7 million people at an average frequency of 20. Its click to purchase rate had fallen from 1.40% to 0.59%.
The audience segments breakdown gives you a second check. If the engaged and existing customer share of spend climbs while net new reach falls, Meta is moving budget toward people who already know you.
The year-over-year data adds one more rule. More net new reach is not always better.
If net new reach rises while landing page view rate falls, Meta is finding new people who never make it to your site. Across the brands we manage, that rate now sits around 81%. If yours falls well below your own baseline, check how fast your page loads before you blame the audience.
So the job is to grow net new reach without losing click quality.
V. Track net new reach weekly and judge it by who lands
Ads Manager will not flag saturation for you. These are the weekly habits we use with the brands we manage.
1. Calculate net new reach every Monday. Use the last two full weeks as Period A and Period B, with account-level totals. Log the result in a sheet so you build your own history.
2. Set your baseline from the account's own past. Use our 60% and 40% ranges as a starting point, then adjust them to what your account normally does.
3. Define your audience segments this week. Add your customer list and engaged audiences in Advertising settings. Meta only tracks segments from the day you set them, so every week you wait is history you lose.
4. Put landing page view rate in the same report. Divide landing page views by link clicks. If net new reach rises while that rate falls, the new people are not reaching your site.
5. When net new reach falls, change who your ads speak to. Launch a new persona or angle, a new format, or new creators in partnership ads that run in a prospecting campaign. Our paper on partnership ads campaign structure shows how we set those up. Bid changes will not fix an audience problem.
6. Push your prospecting campaigns colder on purpose. Exclude past buyers, site visitors and recent page and profile engagers. Test a reach or traffic objective, or a new customer offer, on a modest budget.
7. Judge the fix on new customers. Watch new visitor share and new customer revenue in your own analytics, not platform ROAS. In our experience, net new reach starts to recover within about 10 days of a real change, and new visitor share follows.
Reach and frequency can look calm for weeks while an account runs out of new people. On Monday, calculate last week's net new reach rate and put it next to your landing page view rate. We still do not know how far ahead of a CPA spike the warning shows up. We also have not tested whether the brands that moved most toward new reach lost the most click quality.
About this research
The data comes from Meta ad accounts we manage, May to June 2026 against the same weeks of 2025, checked again in summer 2026. Landing page view rate is Meta's landing page views divided by its link clicks. The main limit is that we cannot say what caused the shift, whether Meta, advertisers or a change in how Meta counts landing page views.
See what this means for your account.
A complimentary growth session, built around your account and your numbers.

Meta Algorithm
Meta Picks Your Winner in 72 Hours, on One Purchase
At 72 hours, the ad Meta goes on to fund has a median of one purchase, and 37% have zero. More data does not make Meta's pick more profitable.

Meta Algorithm
Meta Does Not Push More Spend to Your Higher-Engagement Ads
Across the brands we manage, engagement explains 0.07% of where Meta puts spend, and a jump in likes buys no extra budget the next day. Meta funds sales.

Creative
A Few Ads Carry Every Meta Account. Your Best Ad Fades in 90 Days
The top 10% of Meta ads take 64% of a typical month's spend, and that is normal. The risk is turnover: your #1 ad fades within three months.