

Creative

By
Peter Quadrel
8 min read
Meta's ad impressions grew 107% from 2020 to 2025 while daily active people grew 38%. Each person now sees about 50% more ads. Here is what to do.
Open Instagram and scroll for a minute. It can feel like every other post is an ad.
You feel the same thing from the other side. CPMs creep up, winning ads wear out sooner, and each year it takes more effort to spend more at the same return.
Most brands assume the problem lives inside their own account. So they rebuild campaigns, swap audiences or change agencies. That costs money twice: once in higher ad costs, and again in the learning they throw away with every rebuild.
So we asked a simple question. Does the squeeze start in your account, or on the platform?
To answer it, we went to Meta's own annual reports and earnings releases. We tracked two numbers from 2020 to 2025: how many ads Meta showed, and how many people saw them.
The squeeze starts on the platform. Meta's ad supply grew nearly three times faster than its audience, so the average person now sees about 50% more ads than in 2020.
We found four things: people see more ads, Meta sold volume over price, new placements and markets made room, and Meta's AI cuts repetition.
I. Each person now sees about 50% more Meta ads than in 2020
Two terms matter here. Ad impressions are the number of times Meta showed an ad across its apps. Daily active people, or DAP, is Meta's estimate of unique people who used at least one of its apps on a given day.
Meta does not publish the raw impression count. It reports impression growth each year as a percentage. So we built an index where 2020 equals 100 and each year builds on the one before.
Meta reported impression growth of 10% in 2021, 18% in 2022, 28% in 2023, 11% in 2024 and 12% in 2025. Chained together, those rates take the index from 100 to 207. Impressions more than doubled.
Over the same years, DAP rose from 2.60 billion to 3.58 billion. That is a 38% gain.
The impression rates come from Meta's Form 10-K for 2021, 2022, 2023, 2024 and 2025. DAP for 2020 and 2021 comes from Meta's Q4 2021 earnings presentation.
Impression growth of 107% is 2.8 times the 38% user growth. That is the "nearly 3x" in the title.
Divide the impression index by the DAP index and you get ads per person. That number rose from 100 in 2020 to 150 in 2025, so the average daily user now sees about 50% more ads.
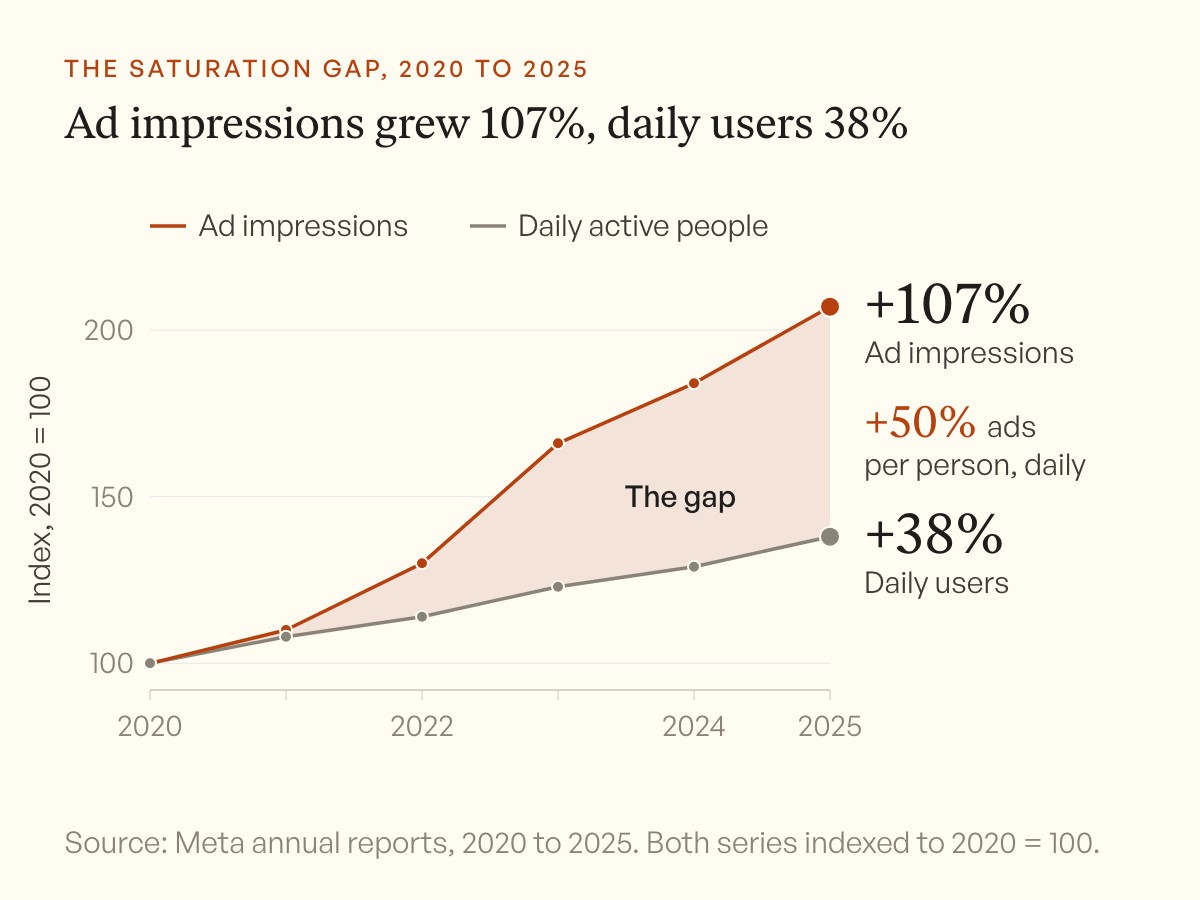
Ad impressions doubled while the audience grew by about a third. The shaded gap is the extra ad load each person now carries.
That works out to roughly 8% more ads per person each year. The gap opened fastest in 2022 and 2023, when ads per person went from 101 to 135.
Those are the same years Meta pushed Reels hard. Meta's 10-Ks for both years say ad growth came from users and from "the number and frequency of ads displayed" across its apps.
So when your CPMs climb or a winner dies faster than last year, the cause is often bigger than your setup. Every advertiser now competes for a thinner slice of each person's attention.
Who paid for all those extra ads, and at what price?
II. Meta grew revenue by showing more ads, not by charging more
Meta's advertising revenue rose from $84.2 billion in 2020 to $196.2 billion in 2025, per the Q4 2021 and Q4 2025 earnings releases. That is a 133% increase.
Price did far less of the lifting. Meta's average price per ad rose in some years and fell in others. Over the five years, it rose about 14% in total.
Impressions roughly doubled while price rose about 14%. Together those two moves explain the revenue growth.
Advertisers put far more money into Meta, and Meta met that demand mostly by showing more ads. For you, that means more rival ads in every feed you buy into.
So where did Meta find room for twice as many ads?
III. The extra ads filled new placements and lower-value markets
Meta found room in two ways. It opened new places to show ads, and its audience grew in markets where each user is worth less to advertisers.
The new places came one after another. Instagram opened Reels ads to advertisers worldwide in June 2021. Facebook Reels ads followed in February 2022.
In October 2022, Meta announced ads in the Instagram Explore home grid and began testing ads in profile feeds.
In 2025, Meta opened two more doors. Threads ads went to all eligible advertisers worldwide in April 2025, after a January test. Ads in the WhatsApp Updates tab were announced on June 16, 2025 and rolled out over the following months.
Each placement adds inventory to the same auction. Meta's 2024 and 2025 10-Ks say Reels earns less per ad than feed does. More time in Reels means more ads sold at lower prices.
The new users came mostly from outside the highest-value markets. Meta stopped reporting Facebook users by region in 2024, but its last regional numbers show where the growth went.
From late 2019 to late 2023, Facebook added 453 million daily users. Asia-Pacific and Rest of World supplied 94% of them.
US & Canada grew 8%, from 190 million to 205 million daily users. Europe grew 5%, while Asia-Pacific grew 43%. These figures come from Meta's Q4 2021 and Q4 2023 earnings presentations, and Meta's Europe includes Russia and Turkey.
Meta says the same thing in its own words. Its 2023 10-K states that user growth was mostly in regions with lower average revenue per user, such as Asia-Pacific and Rest of World. The same filing puts revenue per user in US & Canada at more than 11 times Asia-Pacific.
Its 2025 10-K says ad impression growth is mostly in markets that earn less per ad, such as Asia-Pacific.
If you sell in the US or Europe, your pool of buyers has barely grown since 2019. Meta says impressions grew in every region, so the number of ads chasing those buyers kept rising. Meta does not publish impressions by region, so we cannot size the US gap exactly.
None of this would last if people got tired of the extra ads and scrolled less. Meta knows that, and its newest systems are built around the problem.
IV. Meta is building its AI so more ads feel less repetitive
This section is our read of the numbers. Meta has not said it in these words.
Meta wants to keep growing ad load. It also knows that showing the same ad too often ruins the experience. If people see one ad five times a day, they scroll less and the ads stop working.
The way out is to make every extra ad feel relevant. Meta's recent systems are built to do that.
Andromeda, which Meta described in December 2024, picks a short list of candidate ads for each person from tens of millions. GEM, Meta's Generative Ads Recommendation Model, helps rank that list. Meta's sequence learning work models the order and timing of what each person has done.
Together these systems let Meta show each person more ads, drawn from a wider mix, with less repetition. That only works if advertisers supply the mix. The ads that win are the ones people do not mind seeing.
This ties to two patterns we have covered before. Spend already piles into a handful of ads, as our paper on how few ads carry a Meta account shows. Meta also tends to lock onto what worked before, which we covered in how Meta overfits your account. A thin creative library makes both problems worse in a crowded feed.
So how much creative does a brand need to keep pace?
V. Plan creative supply the way you plan inventory
The brands still scaling on Meta in 2026 treat creative supply as the constraint. Here is how we set it up with the brands we work with.
1. Grow creative output at least 10% a year. Ads per person rose about 8% a year from 2020 to 2025. Total impressions grew 11% to 12% in each of the last two years. Flat output means a falling share of voice.
2. Add new personas every quarter, not only new variants. Ad supply doubled while the audience grew 38%, so the same persona wears out faster. Widen who each batch speaks to.
3. Judge new concepts on the opening second before you judge them on ROAS. More ads per session means more competition for each thumb-stop. Check hook rate and 3-second views first.
4. Put the offer in the first frame and the headline. In a denser feed, the ad with the clearest value wins the impression. Test the offer line there, not only on the landing page.
5. Review CTR and frequency by ad every week. Each person sees more ads a day, so each ad wears out sooner. Keep a queue of fresh concepts ready before the current winners fade.
Every other post feels like an ad because Meta's ad supply outran its audience, and no account rebuild will close that gap. On Monday, count the new concepts you launched last quarter and set next quarter's target at least 10% higher. We still cannot tell you how wide the gap runs in the US alone, because Meta does not publish impressions by region.
About this research
The numbers come from Meta's annual reports and earnings releases for 2020 to 2025, and the placement dates come from Meta's own announcements. Meta only reports ad impressions as a yearly growth rate, so we chained those rates into an index and divided it by user growth. The main limit is that this covers the whole platform, not any one account, so it cannot explain a single brand's results.

Meta Algorithm
Meta Picks Your Winner in 72 Hours, on One Purchase
At 72 hours, the ad Meta goes on to fund has a median of one purchase, and 37% have zero. More data does not make Meta's pick more profitable.

Meta Algorithm
Meta Does Not Push More Spend to Your Higher-Engagement Ads
Across the brands we manage, engagement explains 0.07% of where Meta puts spend, and a jump in likes buys no extra budget the next day. Meta funds sales.

Creative
A Few Ads Carry Every Meta Account. Your Best Ad Fades in 90 Days
The top 10% of Meta ads take 64% of a typical month's spend, and that is normal. The risk is turnover: your #1 ad fades within three months.