

Meta Algorithm

By
Peter Quadrel
7 min read
Across the brands we manage, engagement explains 0.07% of where Meta puts spend, and a jump in likes buys no extra budget the next day. Meta funds sales.
Most media buyers believe Meta rewards engagement. An ad starts to collect likes, comments and shares. Meta reads that as a sign of quality and sends the ad more budget.
We believed it for years too. The belief shapes a lot of daily choices. Buyers pause quiet ads, brief creative to farm comments, and rank ads by hook rate.
If the belief is wrong, each of those choices costs you money. A quiet ad that sells gets switched off. A brief aims at the wrong goal. Your team reads the feed instead of the numbers Meta actually acts on.
So we tested one question across the Meta accounts we manage. Does Meta send more budget to the ads people engage with most?
The answer is no. Meta funds the ads that sell, and engagement explains 0.07% of where the budget goes.
We found that big ads look engaging only because of reach, engagement barely tracks budget, a spike buys no extra spend, and Meta funds sales.
I. Big ads look engaging because they reach more people
The belief feels true for a simple reason. The ads with the most spend often show the most comments.
Those ads reach the most people, so they collect the most likes almost by default. A raw count of likes will always favor the ads Meta already funds.
That is why we used engagement rate, not engagement count. Engagement means likes, reactions, comments, shares and saves, as Meta reports them. Engagement rate is that total per 1,000 impressions.
The rate stops a big budget from inflating the number on its own. You can then compare a small ad and a big ad fairly.
We also split the test in two. The first test asks whether engagement and spend travel together across ads. The second test asks what Meta does after one ad's engagement jumps.
Only the second test can show chasing. But the first test tells you whether there is anything to chase.
So once size is out of the way, how closely does engagement track budget?
II. Engagement explains 0.07% of where the budget sits
We set each ad's engagement rate against its total spend for the first half of 2026.
Engagement rate explains 0.07% of the difference in spend from one ad to the next.
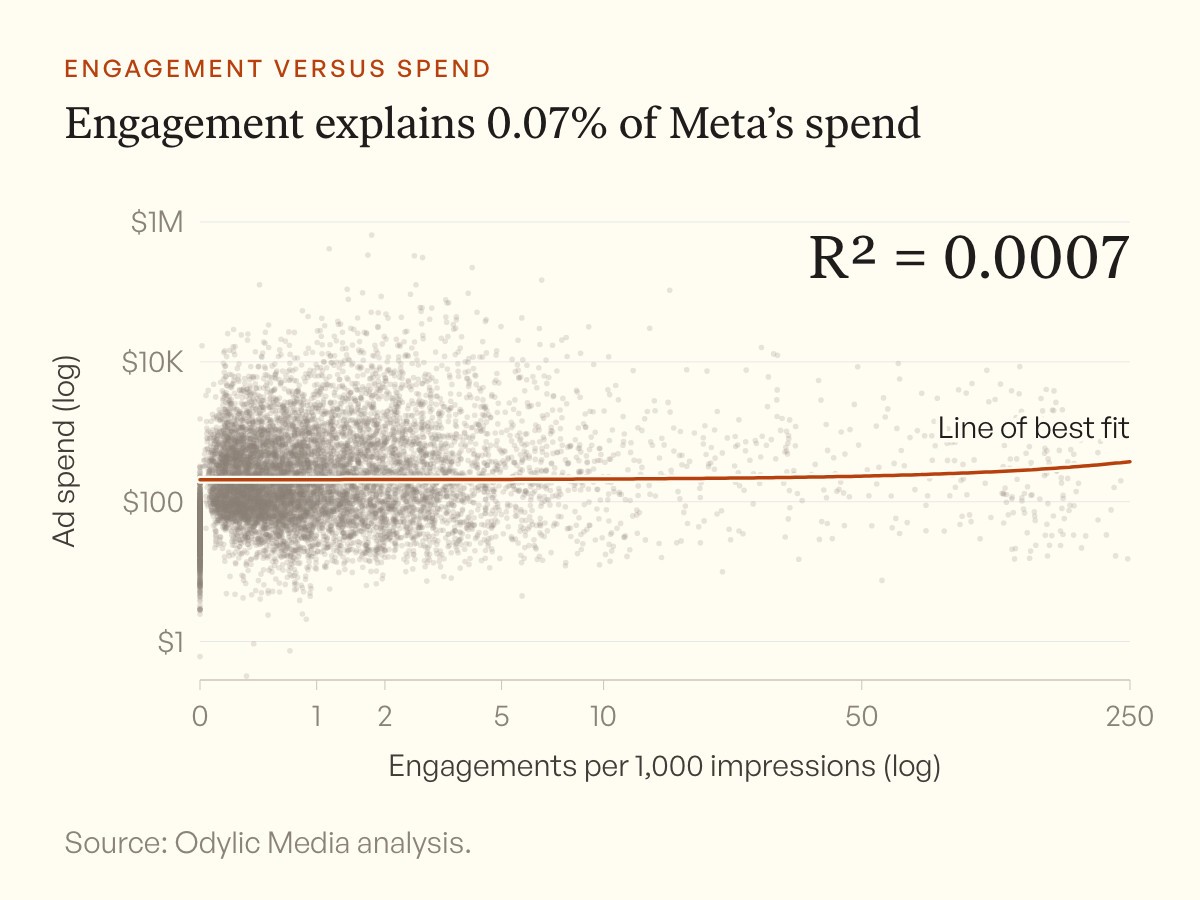
Each dot is one ad. If Meta chased engagement, the cloud would slope up. It barely moves: engagement explains 0.07% of where spend goes.
If you took engagement out of the picture, the spread of spend across ads would look the same.
The link that does exist points the expected way, but it is faint. Ads with more engagement do tend to spend a little more.
Most of that tilt comes from ads that never got going. We sorted the ads into ten equal groups by engagement rate and looked at the median spend in each group.
The lowest group had a median spend of $57 per ad. Every other group sat between $156 and $266.
So the big step sits between the bottom group and everything else. Many ads in the bottom group barely ran, so they had little engagement and little spend.
Among ads that did run, the median moved about $110 from the least engaging group to the most engaging group. Next to how widely ad spend varies, that gap is small.
Brand by brand, the tilt was positive in about two thirds of brands. In most of them it was faint. In a few brands it ran the other way, with more engaging ads getting less spend.
That looks like a weak pattern that changes from account to account. It does not look like a rule Meta applies.
A faint link across ads still leaves the key question open. When one ad's engagement jumps, does Meta respond?
III. A spike in engagement buys no extra spend the next day
Comparing ads with each other cannot show cause. A strong ad could earn both engagement and budget without one causing the other.
To test chasing, you have to watch what Meta does after engagement changes. So we built a daily record for the brands where we had daily engagement data, and we compared each ad only with itself.
We checked whether an ad's spend grew more on the day after its engagement ran higher than usual. We also took the ad's recent spend trend into account. That way an ad already on the rise could not fake a result.
Meta did not respond. A clear jump in an ad's engagement moved its next-day spend by about 0.2%.
The move was slightly down, not up, and too small to tell apart from zero. Even the most generous reading of the data allows less than a tenth of one percent more spend. The result held for video ads and for static ads.
Before we compared each ad with itself, the raw numbers tilted down even more. Ad age explains that tilt.
On half of all days, an ad recorded zero engagement. Those were mostly small, fresh ads spending a few dollars a day. Meta ramped them up, and their spend grew 2% to 7% the next day.
Most days with engagement belonged to older, bigger ads. Their next-day spend drifted down 3% to 9%.
So the downward tilt reflects where each ad sits in its life. It is not a reaction to likes, and it goes away once each ad is compared with itself.
We do not claim that engagement makes Meta cut spend. We claim it does not make Meta add spend.
We ran one more check on small ads. We found days when a still-small ad had a sudden engagement spike. We then compared its spend over the next few days with a similar ad that had no spike.
The spiked ads grew less than the ads they were matched with. Meta did not treat the spike as a reason to scale, for video or for static.
So if Meta is not chasing likes, what is it chasing?
IV. Meta funds the ads that sell, and likes come along for the ride
On a purchase campaign, Meta's job is to find sales. Its delivery system predicts which ad will get the next purchase and sends budget there.
A strong ad earns attention and sales at the same time. People stop, react and buy for the same reason. So engagement and spend move together a little because they share a cause.
Meta funds the ad for the sales, and the likes travel with it.
Our study of how Meta picks a winning ad in 72 hours shows which early signals Meta's spend does follow. That study looked at launch batches, where three or more ads go live in the same ad set on the same day. Inside a batch, every ad shares the same audience, budget and timing.
For each signal, we checked how well its first three days predicted each ad's share of spend over the next ten days. We removed the effect of early spend first. That way each signal shows what it adds beyond Meta's own head start.
ROAS, conversion rate and purchase rate had the strongest link to where Meta sent spend next. Revenue per impression came close behind.
Share rate, save rate and post-engagement rate had a link about half as strong. Comment rate, hook rate, CPM and frequency had no link we could detect.
When every signal competed at once, Meta's own early spend beat all of them by a wide margin. Once you know early spend, no creative metric adds much, including purchase rate.
That is the passenger pattern. At launch, engagement moves with the same ads that convert. Day to day, it adds nothing Meta acts on.
This fits what we see in how a few ads carry most of a Meta account. Budget piles onto a small number of ads, and sales pile onto the same ads.
None of this makes engagement useless. It makes engagement the wrong scoreboard for budget, and that changes how you should judge your ads.
V. Judge ads on what Meta funds, not on what the feed shows
1. Keep a quiet ad that is spending. If an ad holds its share of spend for 7 days and its CPA is at or under target, leave it on. A low comment count is not a reason to pause it.
2. Rank creative on bottom-funnel numbers. Sort your ads by purchase rate, conversion rate and ROAS. Those track where Meta sends budget. Hook rate, CPM and frequency do not.
3. Read Meta's pick from the spend split at 72 hours. Early spend share was the strongest sign of where budget went next. Adding every creative and funnel metric on top barely improved the forecast.
4. Brief for the sale on purchase campaigns. Do not build an ad to farm comments and expect delivery to follow. Write the brief around the product, the proof and the offer.
5. Use engagement for what it does well. Read the comments for objections, questions and proof worth quoting. Treat engagement rate as a read on how people react, not a forecast of budget.
Think back to the ad in the opening that starts to collect likes. Meta does not fund it for the likes, and it will fund it only if it sells.
On Monday, sort your ad report by purchase rate and ROAS, and take comment count and hook rate out of your pause rules. We still do not know how Meta's model uses engagement, because we can only see where the spend went.
About this research
The data comes from Meta ad accounts we manage for DTC brands, mostly on purchase campaigns, from January 2025 to June 2026. Engagement means likes, reactions, comments, shares and saves as Meta reports them, divided by impressions so a big ad does not win on size alone. We measured by the day and on paid ads only, so this shows what Meta's spend follows, not what happens inside Meta's model.

Meta Algorithm
Meta Picks Your Winner in 72 Hours, on One Purchase
At 72 hours, the ad Meta goes on to fund has a median of one purchase, and 37% have zero. More data does not make Meta's pick more profitable.

Creative
A Few Ads Carry Every Meta Account. Your Best Ad Fades in 90 Days
The top 10% of Meta ads take 64% of a typical month's spend, and that is normal. The risk is turnover: your #1 ad fades within three months.

Measurement
New Meta Accounts Should Run the Least Accurate Attribution
New Meta accounts should start on the loosest attribution setting, even though Meta's own incremental model backs only about 68% of the revenue it reports.