

Creative

By
Peter Quadrel
7 min read
The top 10% of Meta ads take 64% of a typical month's spend, and that is normal. The risk is turnover: your #1 ad fades within three months.
Sooner or later, almost every brand on Meta asks us the same question. They have dozens of ads live, and Meta spends most of the budget on three or four of them.
Most teams treat this as a problem. They pause the ads with no sales, cap the winner, or launch more ads to spread the risk. Each move takes time, and some of them pull money away from the ads that sell.
The bigger cost sits somewhere else. The ad carrying your account today will most likely not carry it in two months, and most brands have nothing ready to replace it.
So we asked whether a few ads taking most of the budget is a problem, and how long the top ad stays on top.
The answer is simple. A few ads carrying the account is normal and Meta mostly funds the right ones, but your top ad fades within 90 days.
We found that concentration is normal, daily views make it look worse, Meta funds the ads that sell, and your top ad fades fast.
I. A few ads carrying the account is normal
The question usually comes in as if something is broken. Most people who ask it have never seen inside other accounts, so they have nothing to compare against.
We have, and we did not find a single account that spreads its budget evenly.
In the typical month, the top 10% of ads took 64% of spend. Every account we looked at sat above 50%. The most concentrated reached about 81%.
It takes only 22% of the ads to reach 80% of spend. The single biggest ad takes about 17% of the month on its own.
About four ads usually sit far above the rest. Together they take 42% of the month's spend.
The ad that seems to have taken over the account is usually just the top of a normal curve. Ad set and campaign budgets stop any one ad from taking everything. A true runaway ad showed up in only about 4% of months.
The pile-up happens inside ad sets. Spend spreads much more evenly across campaigns and ad sets than across the ads inside them.
Adding more ads does not change the shape much. When an account doubled its live ads, the budget spread out only about 40% more. That held in most accounts.
The pattern is also not getting worse. We compared January to June 2026 with the same months in 2025. The top ad's share went up in half the accounts and down in the other half.
So if the shape is normal, why does it feel so extreme when you open Ads Manager?
II. Daily views and unfunded ads make it look worse
The shorter your view, the more lopsided the account looks. The biggest ad takes 22% of a single day's spend. Over a month, it takes 17%. Over a year, it takes 8%.
Meta rotates delivery inside the month. On any given day, only 30% of the month's active ads spend at least $1.
So a Tuesday look at Ads Manager will always show a handful of ads doing all the spending. Treat that view as a snapshot of one day.
Your live ad count misleads you too. More than half of the ads that spent anything spent under $100 all month. One in five spent under $10.
Count only the ads that spent $100 or more, and the top 10% share drops to about 44%. Much of the alarm in the headline number comes from ads Meta had already dropped.
The top of the curve does not move. The biggest ad takes about 16% of spend whether you count every ad or only the ones above $100.
The zero-sale ads look scary for the same reason. In the typical month, 55% of active ads recorded zero purchases. Those ads held only 8.5% of spend.
Meta starved those ads long before anyone went looking for them. Pausing them by hand moves almost no money.
The ads that matter are the ones Meta funds. That leaves one fair question. Is Meta funding the right ones?
III. Meta is funding the ads that sell
The fear is that Meta is starving a hidden winner. Our data says it is not.
We ranked ads by spend, then checked what share of purchases the top spenders brought in. Meta's top 10% of ads took 62% of budget. Those same ads delivered 66% of purchases, slightly more than their share.
A later check on July and August 2026 data agrees. The top 10% of ads by spend ran a 1.71 ROAS. Everything else ran 1.12. That gap held in most accounts.
The gap is wider on new customers. There, the top 10% ran a 1.62 ROAS. The rest averaged 0.93, below break-even.
The ad Meta puts on top is a new-customer ad. In every account, the #1 ad sent most of its spend to people Meta counts as new. It sent 94.7% of its spend to new people, while the account's other ads sent 89.3%.
Revenue piles up even harder than spend, and that held in every account. In the typical account, the top 10% of ads took 69% of spend. The same ads brought in 79% of revenue.
Some of that gap is noise, because each ad has only a few purchases in a month. That is why we ranked ads by spend first. Either way, the direction is the same.
Forcing spend across more ads pushes dollars toward the weaker ones. Leave your winner alone.
So if Meta picks well, how long does its pick stay on top?
IV. Your top ad fades within 90 days of its peak
The shape of the account holds steady. The names at the top change.
The #1 ad stays #1 the next month only 30% of the time. It stays in the top ten 70% of the time. Its typical run at the top lasts one month.
The decay is fast. In its peak month, the #1 ad held 16% of spend. One month later it held 7%. Two months later it held about 2%, and by the third month it held nothing.
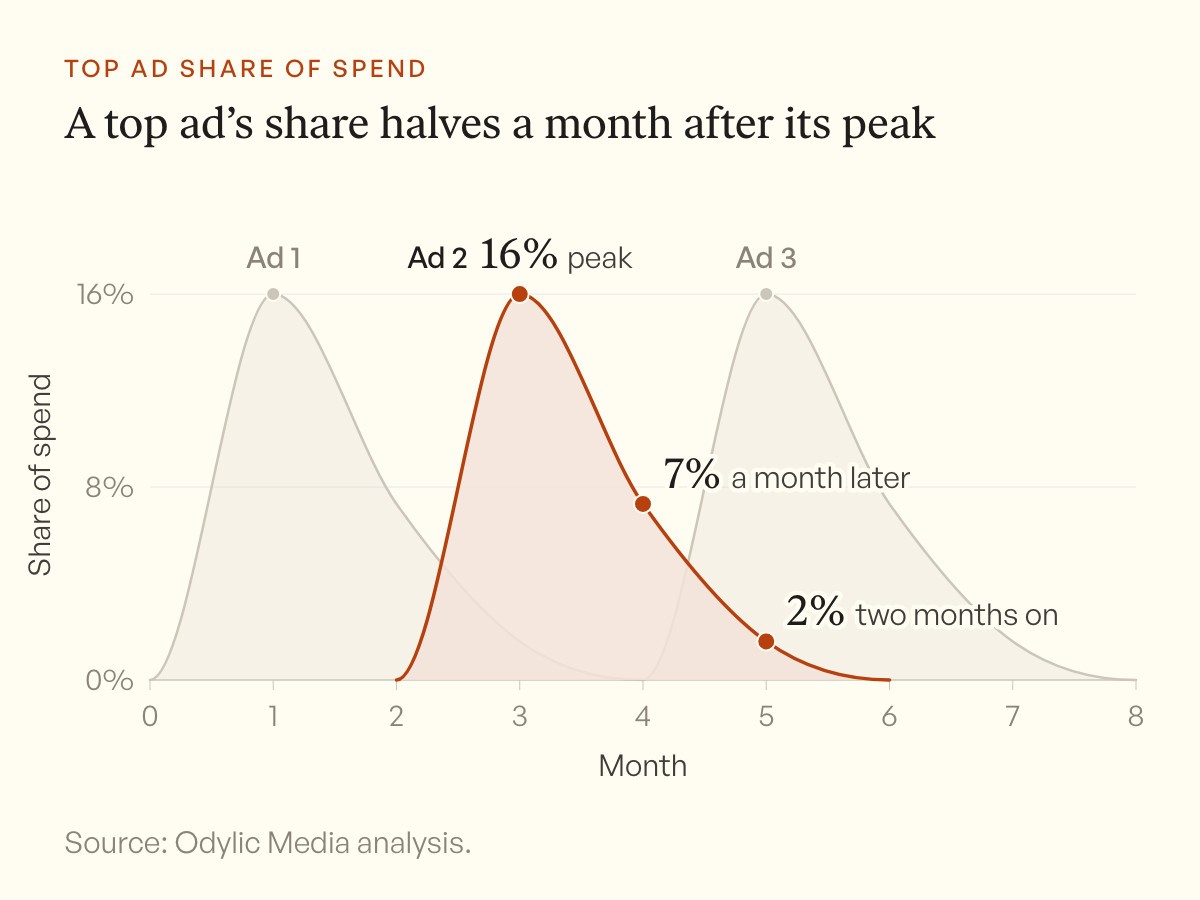
The #1 ad peaks near 16% of spend, falls to 7% the next month and is gone within three months.
The winner loses more than half its share right after it wins, and a newer ad takes the slot.
Over 11 months, the typical account ran seven different ads through the #1 slot. That works out to a new top ad about every seven weeks.
The replacements are young. In any month, 61% of the ten biggest ads had launched in the previous 30 days. The typical top-ten ad was 13 days old when its month started.
Meta also makes its call quickly. Our study of how Meta picks a winning ad in 72 hours shows how early that happens. Your next winner needs to be live before the old one fades.
Over a year, this turnover adds up. The ads that made a monthly top three at some point took 47% of the year's spend.
Four ads will carry your account next month too. They will just be a different four, and most of them will be less than a month old.
That changes where your team should spend its week.
V. Build the next winner before the current one fades
1. Read concentration on the month, not the day. A top ad near 16% to 17% of monthly spend is normal. On a single day, 22% is normal too.
2. Set a $100 floor before you count ads. At that floor, a top 10% share around 44% is typical. An ad that spent less than $100 in a month was never really in the running.
3. Stop pausing zero-sale ads to save budget. They are about 55% of ads and only 8.5% of spend. Pause them to keep the account tidy if you like, but expect no change in results.
4. Leave the winner alone. Do not cap it or split its budget to force spread. The top 10% runs a 1.71 ROAS against 1.12 for the rest.
5. Plan for a new #1 about every seven weeks. When your #1 peaks, assume it holds about half that share next month. Start the replacement brief that same week.
6. Launch new ads every week, and make them different. Most of the ten biggest ads in any month are under 30 days old. New ads should reach new buyers instead of repeating the winner. Our paper on how Meta overfits your account to one buyer explains why.
The brand with dozens of live ads and three or four doing the spending does not have a broken account. On Monday, find the month your #1 ad peaked, and if that was last month, start its replacement this week. We still do not know why each winner fades, only that it fades fast.
About this research
The data comes from the Meta ad accounts of the brands we manage, mostly consumer DTC brands, from January 2025 to August 2026. An ad counted as active in a month if it spent at least $1, and every number describes a typical month in a typical account. Purchases are Meta's own reported numbers, and the study shows how Meta splits spend, not why each winner fades.

Meta Algorithm
Meta Picks Your Winner in 72 Hours, on One Purchase
At 72 hours, the ad Meta goes on to fund has a median of one purchase, and 37% have zero. More data does not make Meta's pick more profitable.

Meta Algorithm
Meta Does Not Push More Spend to Your Higher-Engagement Ads
Across the brands we manage, engagement explains 0.07% of where Meta puts spend, and a jump in likes buys no extra budget the next day. Meta funds sales.

Measurement
New Meta Accounts Should Run the Least Accurate Attribution
New Meta accounts should start on the loosest attribution setting, even though Meta's own incremental model backs only about 68% of the revenue it reports.